At Steamclock, we’ve built a lot of apps. Until now though, we’ve never built one with a scope like this:
Build an interactive, cross-platform, 3D map of the internet.
That’s what our client, Peer 1 Hosting, asked us to do: spend three months building something fun, challenging, interactive, and beautiful. It doesn’t get much better than that.
The project started with data from CAIDA, an organization that monitors and analyzes internet traffic, and Jeff Johnston, who had worked with Peer 1 previously to produce a poster of the internet. Jeff used CAIDA’s data on the Autonomous Systems that route traffic online to produce a 3D model based on the concept of Eigenvector Centrality.
Data in hand, we used OpenGL and tens of thousands of point sprites to bring the data to life. In order to make the app extremely performant on both iOS and Android, we built the rendering components in C++ and the app’s user interface in Objective-C and Java, using each platform’s native UI toolkits.
Once we had demos running of the app, it was obvious there was a lot more that we could do to make it interactive and educational. Jeff was able to obtain data ranging back to 1995 and forward to 2020, using a combination of historical and simulated data about the growth of the internet. We mixed in events from the internet’s history to illustrate the story of its progress.
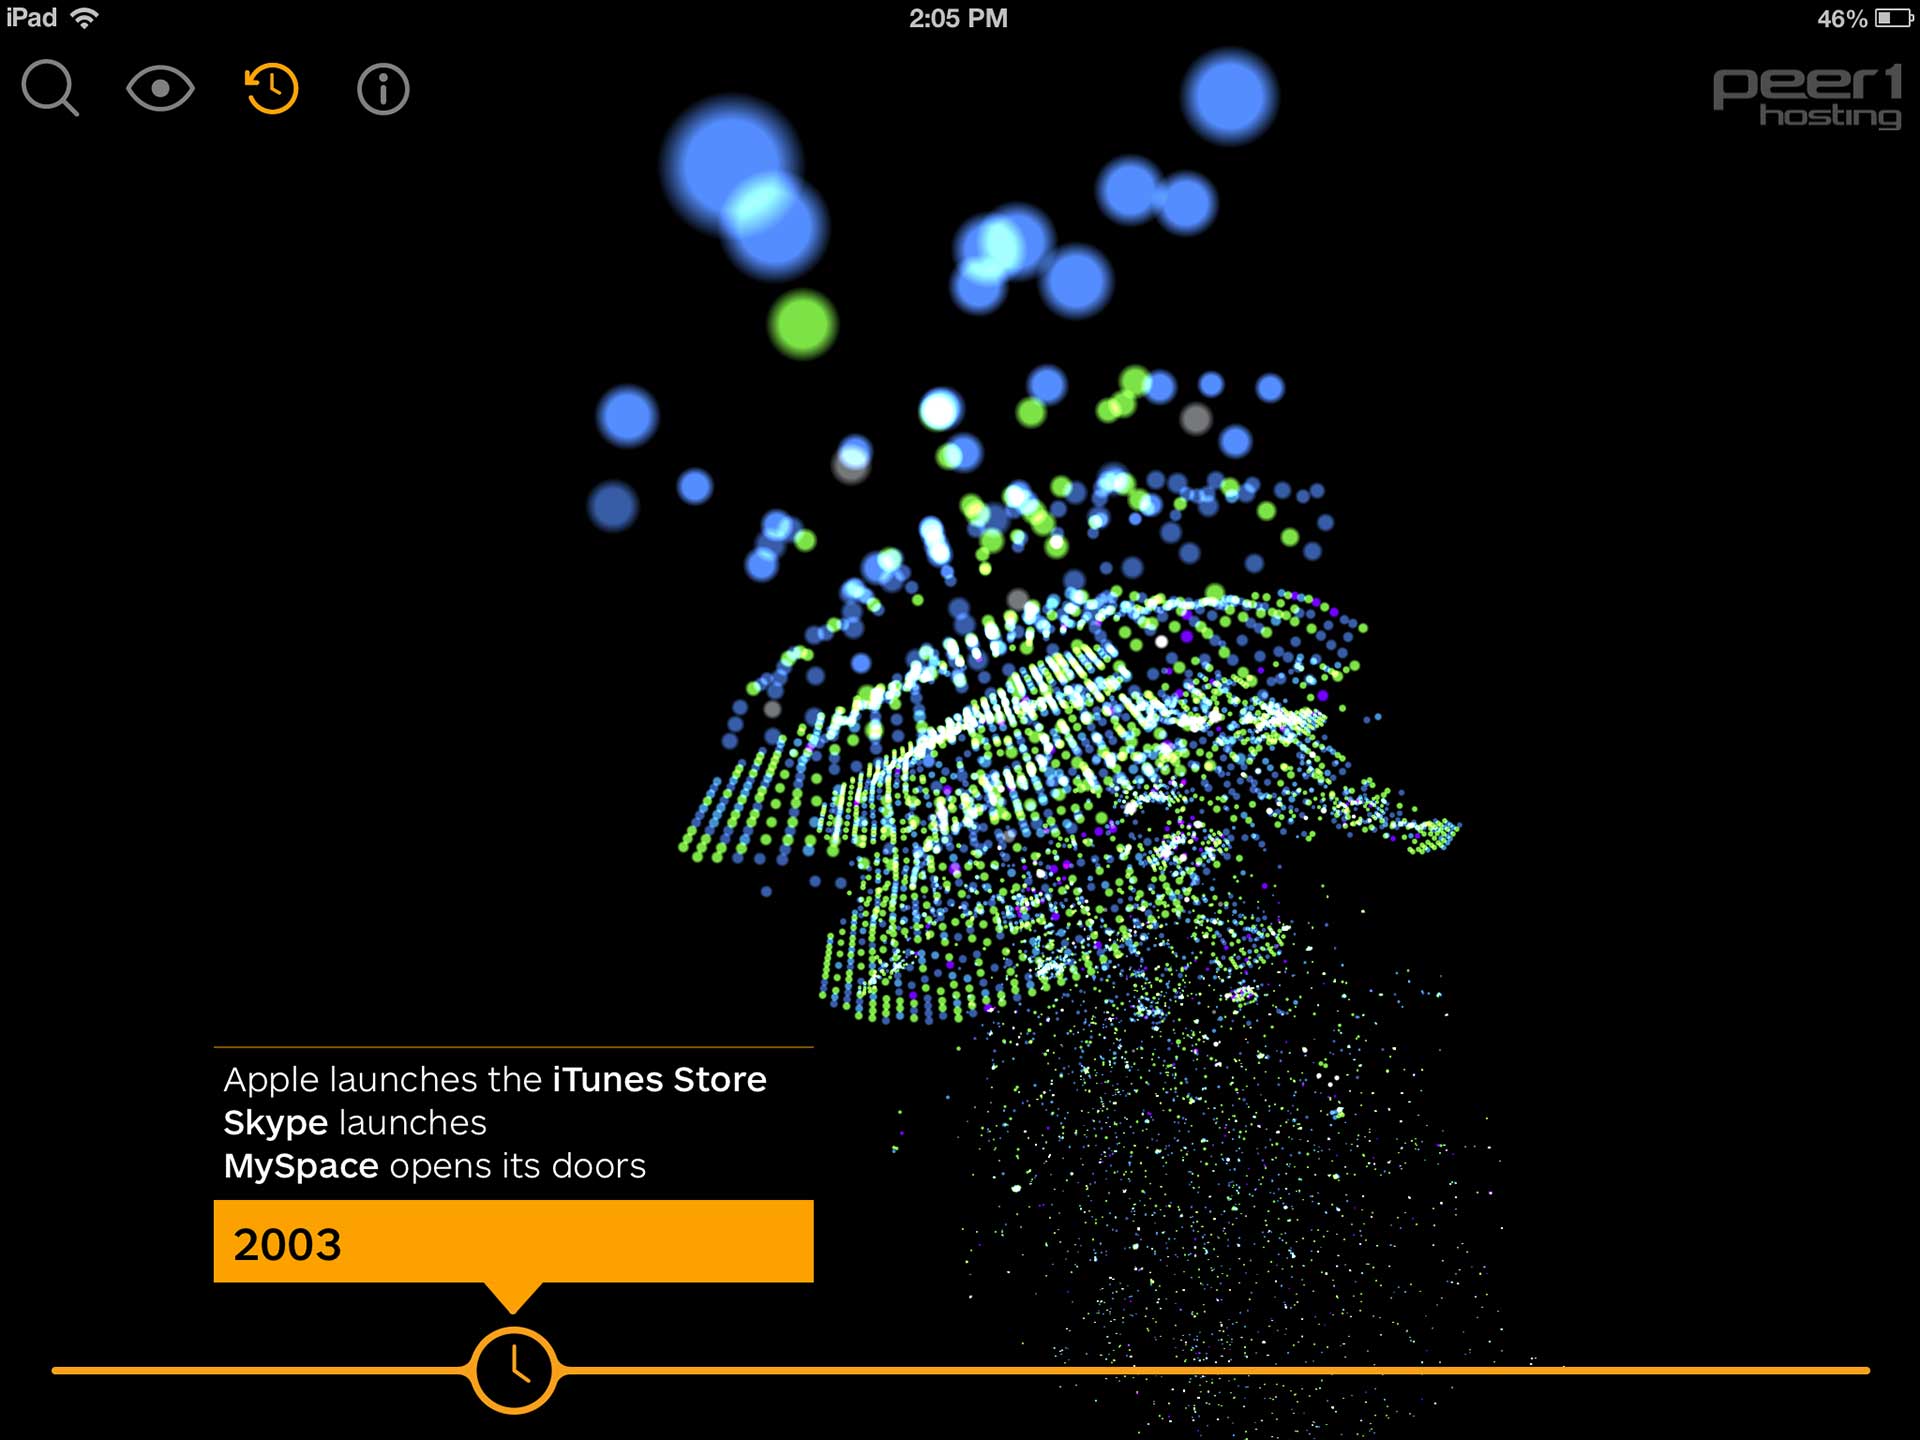
A screenshot of the Timeline mode in the app.
To make the app more interactive, we added live data. We added a “you are here” feature which shows your network on the map. We also built a search feature to find other companies and domains. Finally, on iOS, we created a traceroute function to map the route between your current network and any other network on the map. This was actually an interesting challenge, because without raw sockets support on iOS, we needed to write our own traceroute implementation!
OpenGL made it fairly straightforward to support both tablets and phones on both iOS and Android, but as our most complex Android app to date, we had a lot of testing to do. We bought some more devices on eBay, and loaned even more from Wavefront. We saw our fair share of Android quirks, driver issues, and just plain bugs. In the end though, there was only one device we couldn’t support: the Motorola Milestone 3. OpenGL on that device was so borked that it was rendering multiple buffers on the screen at once, resulting in an unusable mess.
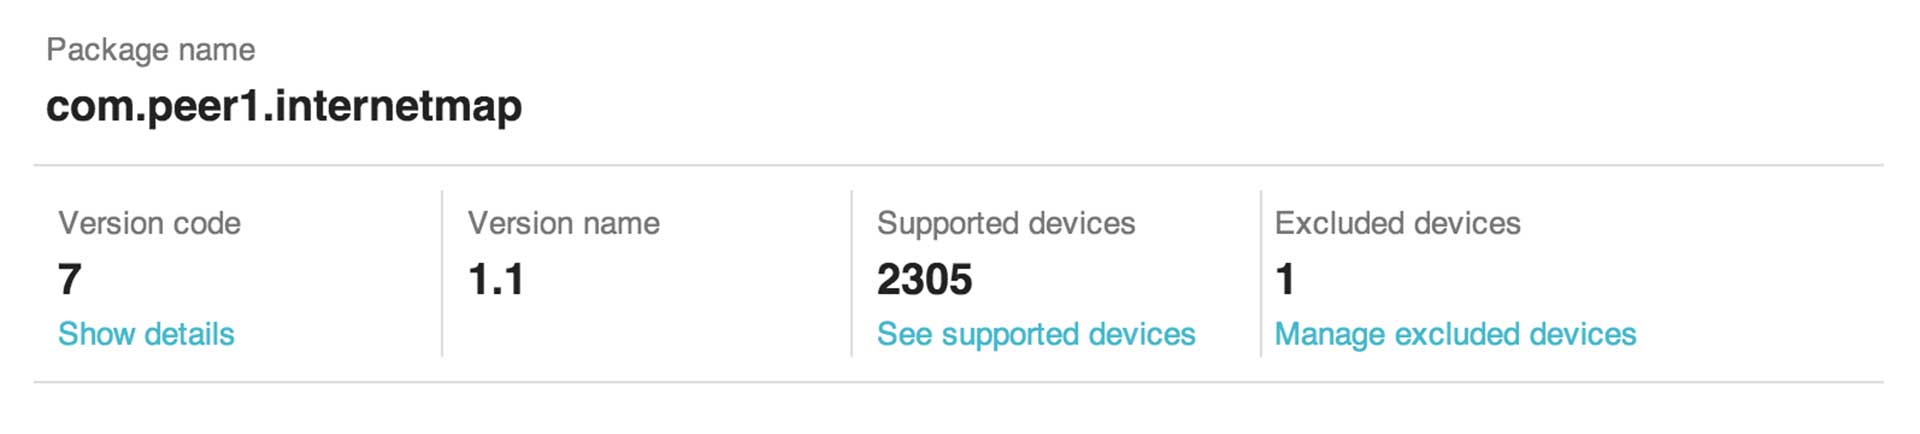
Our device compatibility section in the Google Play store.
After three months of development and refinement, we went live on March 6. The launch was a huge success, and was featured by CNN, NetworkWorld, and GigaOm.
“This fascinating app represents the Internet and highlights its different aspects.” – CNNMoney
In just 5 days, the app was downloaded by 8000 people on Android and 16000 on iOS. We ranked among the top Education apps on both iOS and Android app stores, and received glowing reviews (4.6 on Android, 5 stars on iOS).
We want to put out a huge thanks to our friends at Peer 1, Jeff Johnston, and everybody who worked hard on this project. Get it for free on the iOS App Store or Google Play.
